
Provided here is information about:
The Utility Updates page lists those utilities that have reached or are nearing their Utility Credit cap. A Utility Credit cap is defined as: one and one-half percent of the businesses’ taxable power sales generated in calendar year 2014 and due under RCW 82.16.020 (1) (b), or two hundred fifty thousand dollars, whichever is greater, up to the utility’s public utility tax liability.
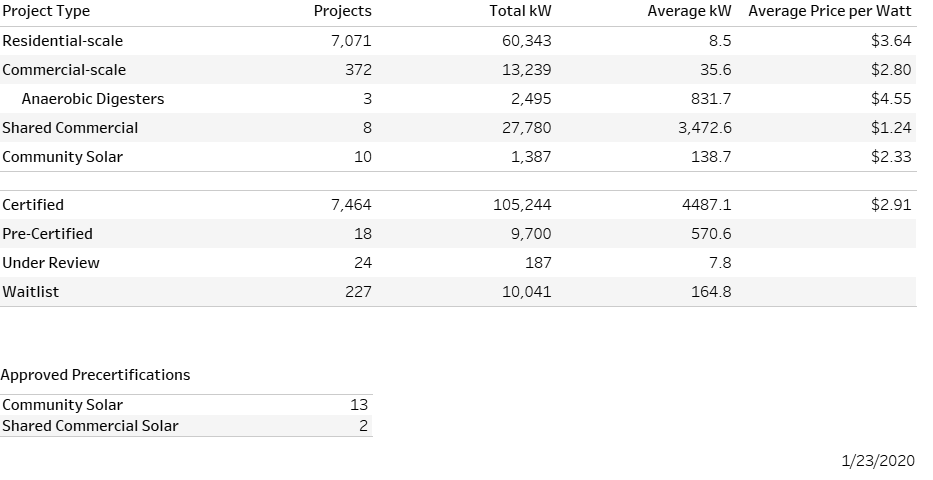
The following utilities have reached or are nearing their Project type caps. Project type caps are defined as:
| Participating Utility | Commercial-Scale | Shared Commercial and Community Solar |
| AVISTA | Funds Available | 39% of the funds for these project types are completely reserved. |
| BENTON RURAL ELECTRIC ASSOCIATION | 51% of the funds for this project type has been applied for and are pending certification. Approximately $47,150 remains for commercial-scale projects. | Funds Available |
| CITY OF ELLENSBURG | 25% of the funds for this project type has been applied for and are pending certification. Approximately $27,000 remains for commercial-scale projects. | Funds Available |
| CITY OF PORT ANGELES | Funds Available | 68% of the funds for these project types are completely reserved. |
| JEFFERSON COUNTY PUD 1 | 43% of the funds for this project type has been applied for and are pending certification. Approximately $39,800 remains for commercial-scale projects. | 28% of the funds for these project types are reserved. |
| MASON COUNTY PUD 1 | 25% of the funds for commercial-scale projects has been applied for and are pending certification. Approximately $26,600 remains for commercial-scale projects. | Funds Available |
| PACIFIC POWER & LIGHT COMPANY | 43% of the funds for this project type has been applied for and are pending certification. Approximately $388,440 remains for commercial-scale projects. | Funds Available |
| PENINSULA LIGHT COMPANY | Funds Available | 100% of the funds for these project types are reserved. |
Per Engrossed Substitute Senate Bill 5939, participating utilities may incentivize up to one and one-half percent of the businesses’ taxable power sales generated in calendar year 2014 and due under RCW 82.16.020 (1) (b), or two hundred fifty thousand dollars, whichever is greater, up to the utility’s public utility tax liability.
Each bar below represents the utitities’ credit cap and shows an estimate of:
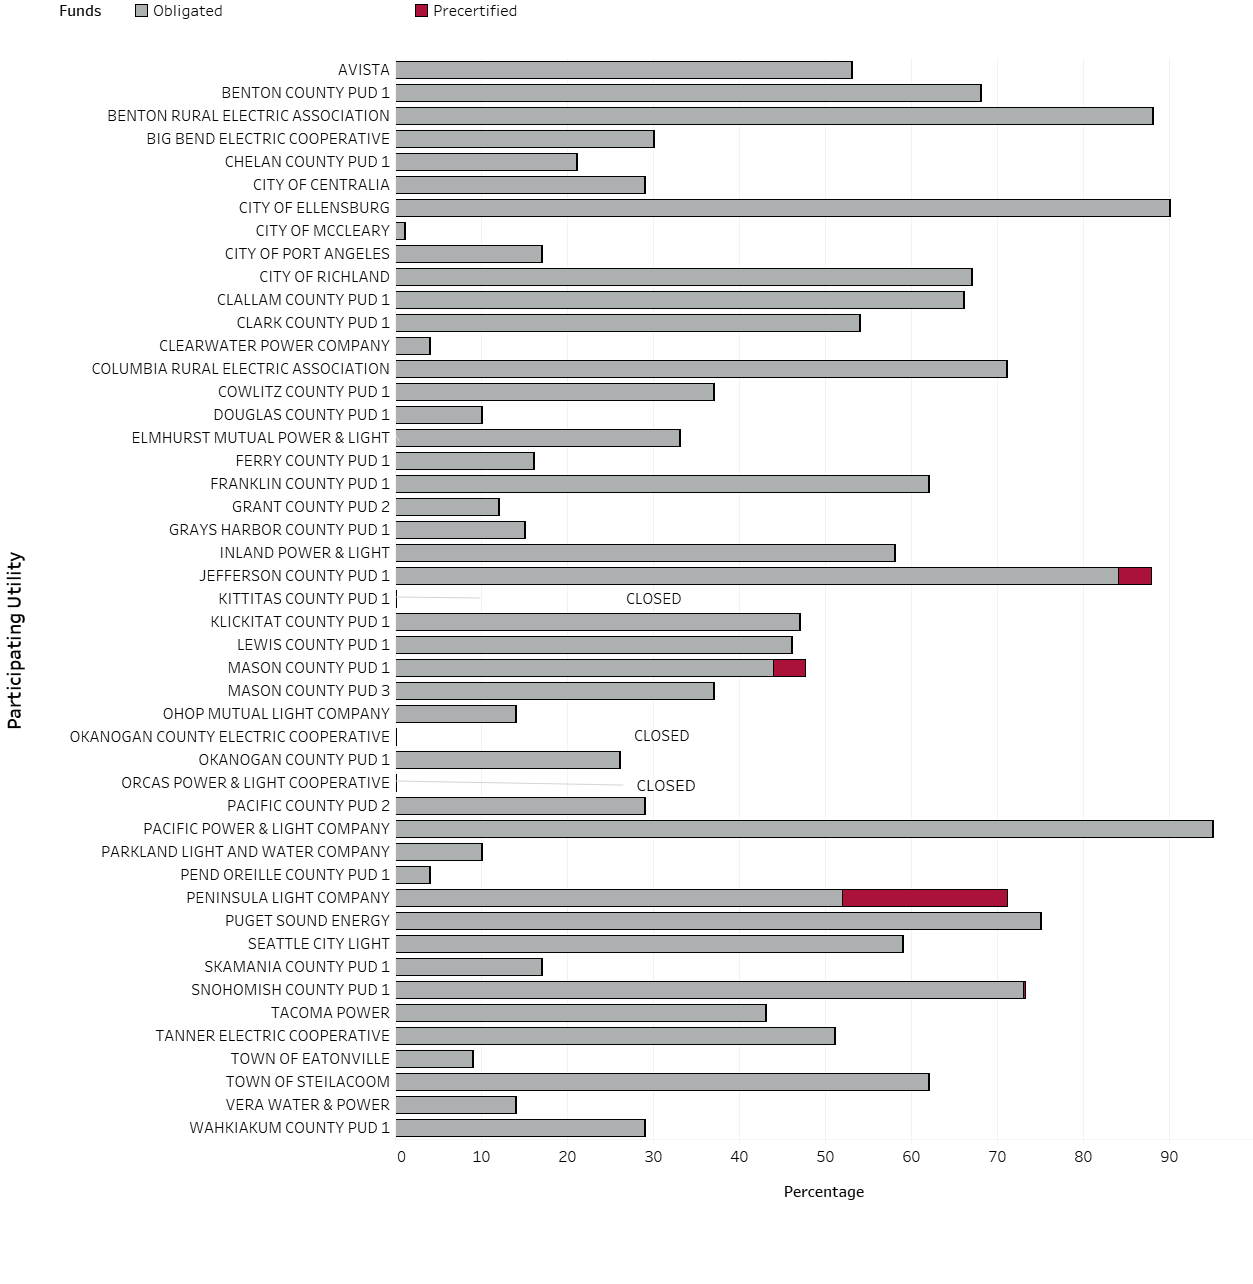
Obligated funds for the Renewable Energy Cost Recovery Incentive Program are estimated by adding the estimated incentive payments certified by the Department of Revenue in Q1 of fiscal year 2018 to the utilities’ incentive payments for fiscal year 2017. Renewable Energy Cost Recovery Incentive Program funds are obligated assuming full reapplication from current incentive recipients.
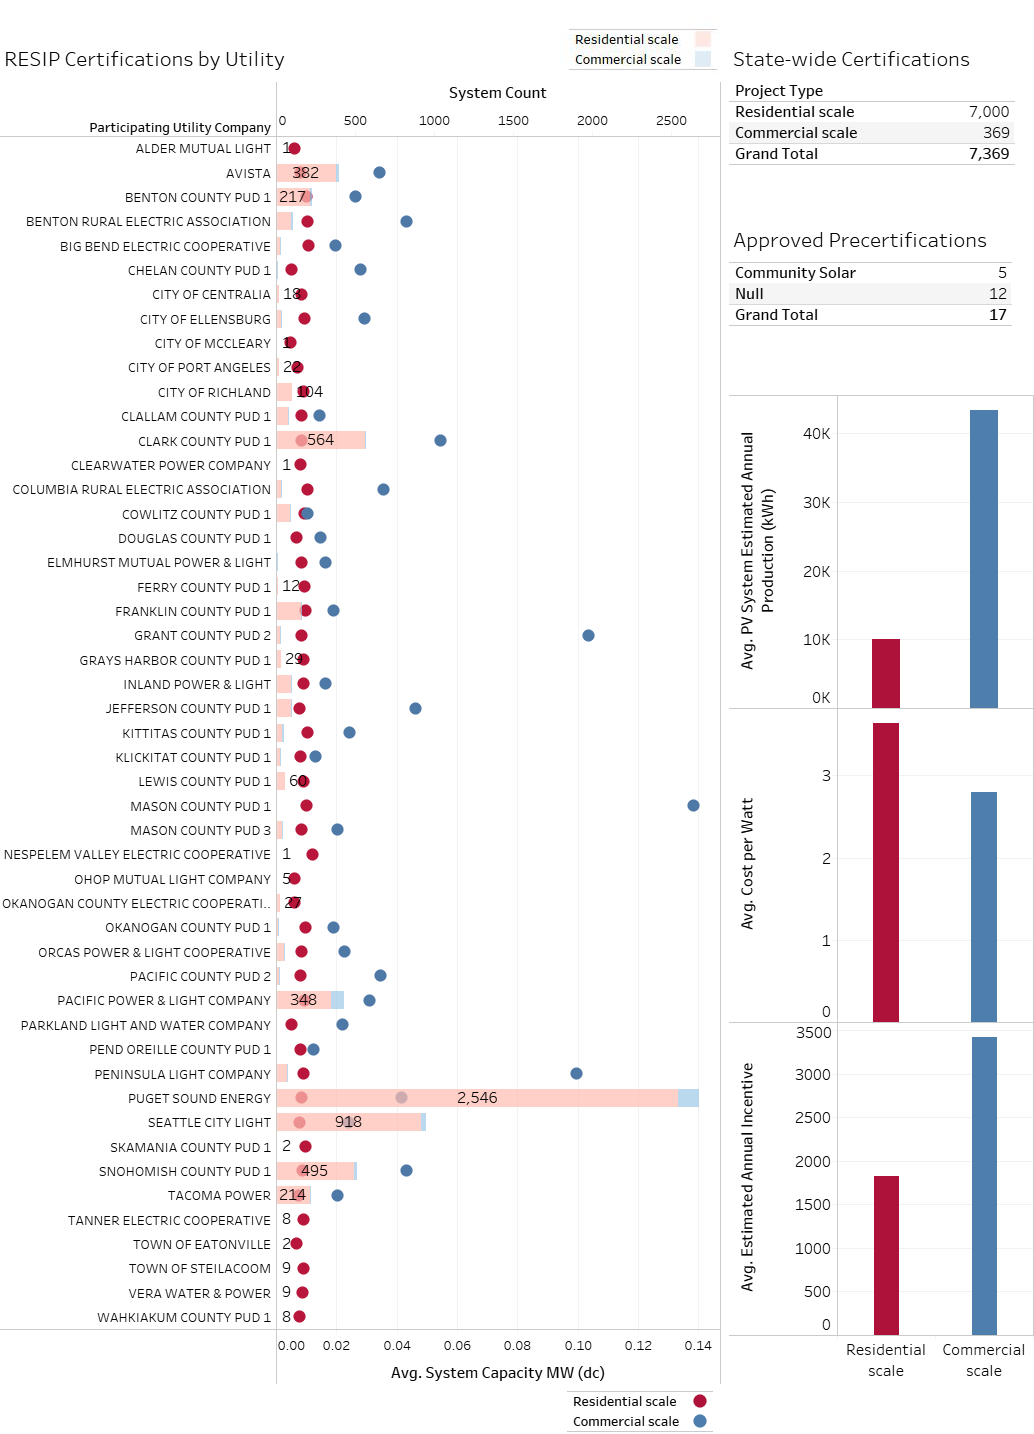
Data presented here represent the number and average system capacity of Renewable Energy System Incentive Program (RESIP) systems. Equivalent statistics for Renewable Energy Cost Recovery Incentive Program (RECRIP) systems can be found here.
By utility information on certified projects is shown on the left of the display below. The number of systems (system count) are shown with bars, the average system capacity (MWdc) represented by circles for residential-scale and commercial-scale project types. State-wide summaries of the number of certified projects and projects with approved precertifications by project type are seen on the right. In addition, state-wide averages for estimated average annual energy production, cost per watt, and annual incentive yields are shown for certified projects.
Interactive program summaries and additional utility-specific information are under development.
These maps show the capacity of systems from the Washington state renewable energy incentive programs.
Interactive maps are under development.
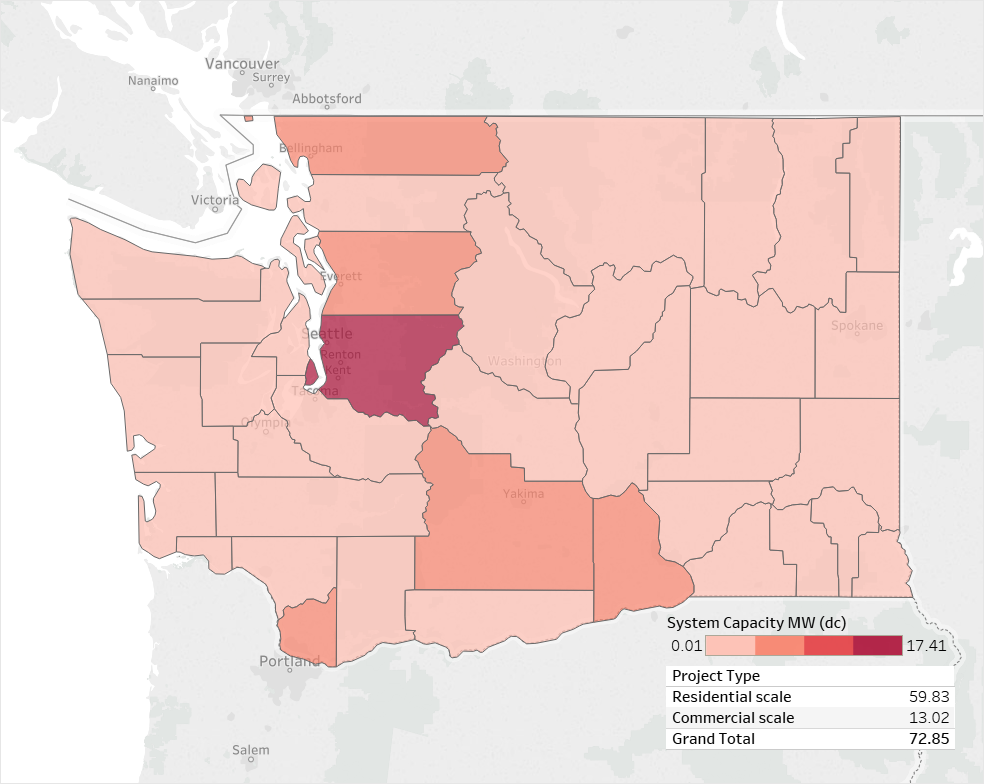
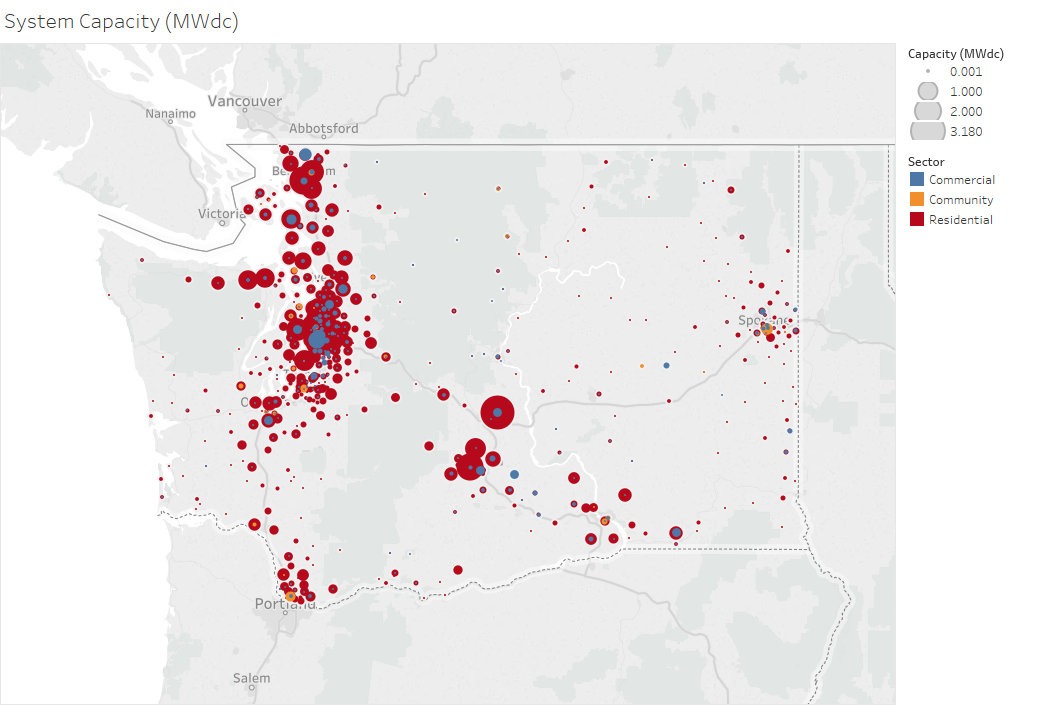
The Zip Code of the site is being used to locate systems. The placement of the site is at the geographic center of the zip code, not the location of the site itself.
Data Current through 1/23/2020